
Analyzing CFX Run Data
After the CFX run has finished, the instrument links the data collected during the run to the run file, and then updates the file to a completed run that opens in the Analysis page. From the Analysis page, you can review, analyze, and export data from the run.
The following defaults apply to all CFX run files when they are first opened:
| ● | All wells that were run are selected. |
| ● | The analysis mode is set to Fluorophore. |
| ● | For each selected well, each fluorophore is represented by a colored trace in the Amplification chart. |
| ● | Baseline subtraction in Analysis setup is enabled. |
| ● | All fluorophores are enabled in the Filters pop-up. |
| ● | Data for each fluorophore in each well is shown in the table on the right. |
| ● | The step producing the data appears in the Step field. |
| ● | If the run contains amplification data, the amplification analysis page opens automatically and you can click a button to access other data types. |
| ● | If the run contains melt curve data only, the melt curve analysis page opens automatically. |
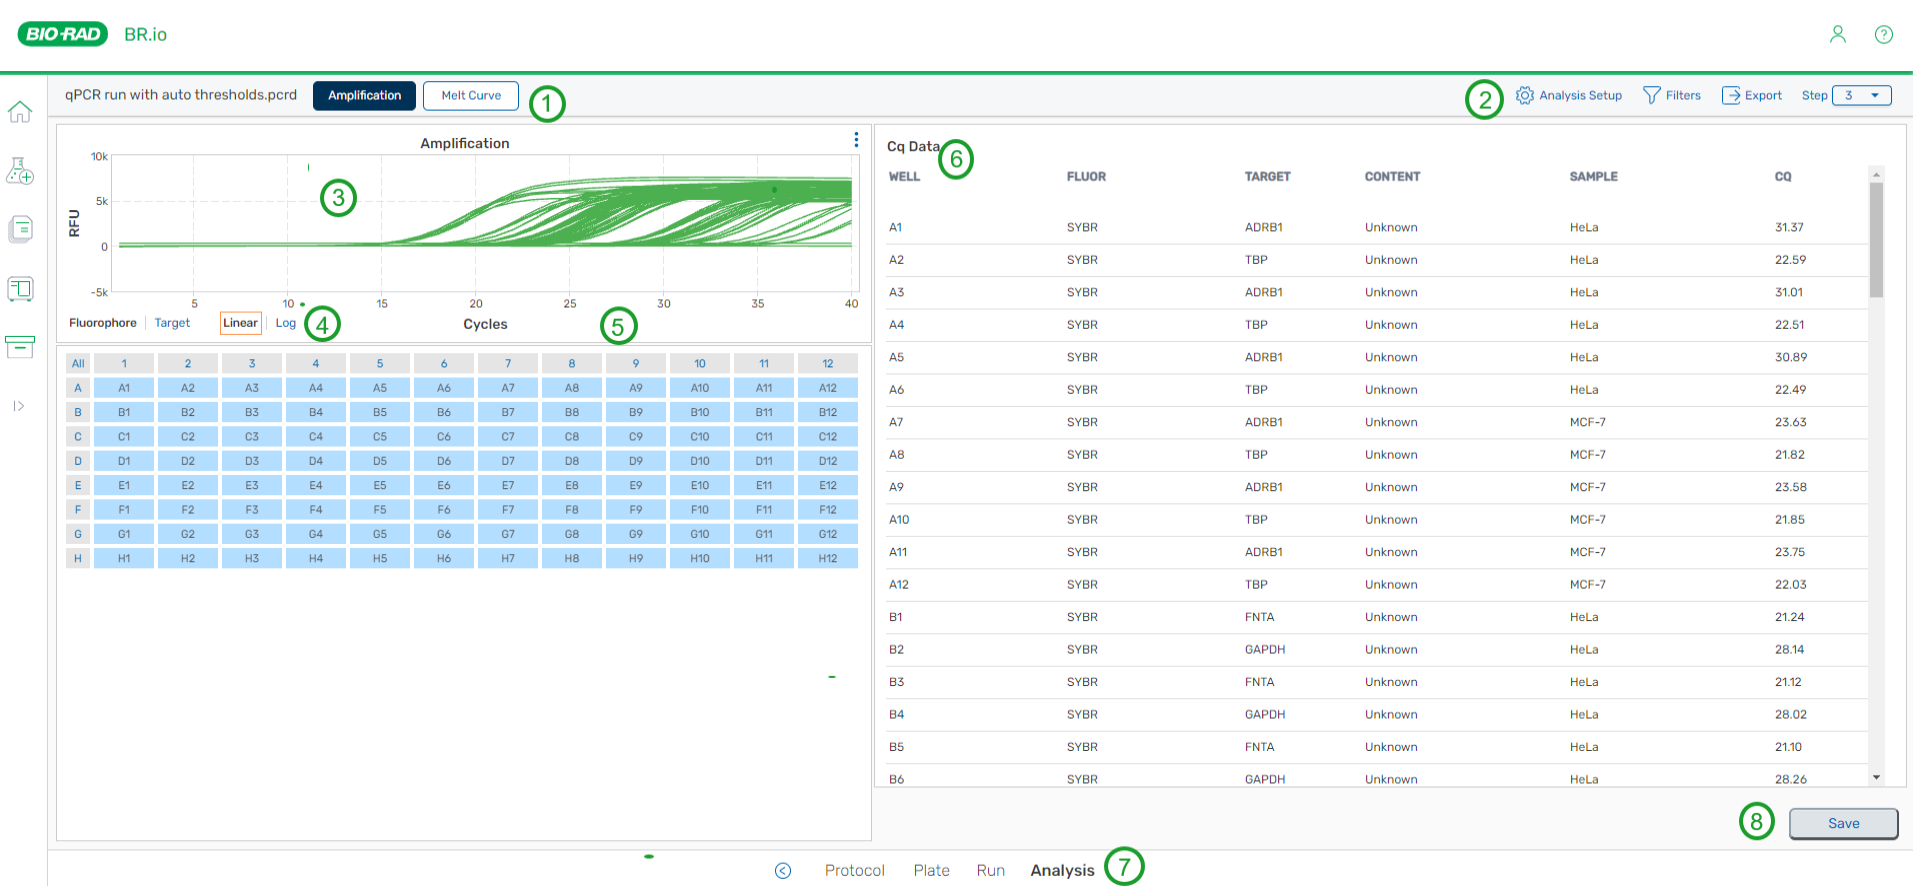
Elements of the amplification analysis page are highlighted in the following graphic and explained in the associated legend.
|
|
Completed CFX run name and button indicating the data type Data type (Amplification or Melt Curve) Note: If the file contains melt curve data, a melt curve button also appears. For information, see |
||||||||||||
|
|
Toolbar, where you can
Note: Additional steps are available only when the run contains more than one step with a plate read. |
||||||||||||
|
|
Chart, representing the data type from the run, such as an amplification chart or melt curve chart |
||||||||||||
|
|
Amplification chart or melt chart toggle links |
||||||||||||
|
|
Well selector |
||||||||||||
|
|
Data table (CQ or melt data) |
||||||||||||
|
|
CFX workflow navigator |
||||||||||||
|
|
Save button, which becomes enabled when you make a change to the file |


