
Analysis Options
You can use the analysis options to change your analysis setup, filter fluorophores, and to select a different step for data analysis.
Changing Analysis Setup
When you select Analysis Setup, a variety of options appear in the following sections, depending on the type of data collected:
| ● | For amplification data you can disable automatic baseline subtraction to view or export raw RFU data, enable drift correction, manually set baseline cycles by target or fluorophore, and manually adjust thresholds. |
| ● | For melt curve data, you can manually adjust melt peak thresholds |
To make changes in Analysis Setup in Amplification mode
| ► | In the toolbar, click Analysis Setup to display the Analysis Setup dialog box. |
Choose from the following options:
| ● | Disabling Baseline Subtraction |
| ● | Enabling Fluorescence Drift Correction |
| ● | Setting Baseline Cycles |
| ● | Setting Manual Thresholds |
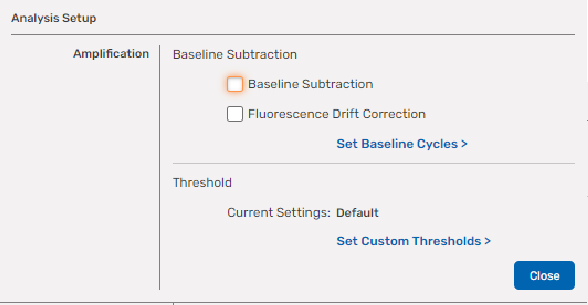
Disabling Baseline Subtraction
If you clear the Baseline Subtraction checkbox, BR.io displays the data as relative fluorescence traces and does not apply correction.
To disable baseline subtraction
| ► | Clear the checkbox in the Baseline Subtraction section. |
Baseline subtraction is disabled immediately and you can see changes in the trace display.
Enabling Fluorescence Drift Correction
For wells that have abnormally drifting RFU values during the initial few cycles of the run, applying drift correction enables the software to derive an estimated baseline from adjustment wells for which a horizontal baseline was successfully generated.
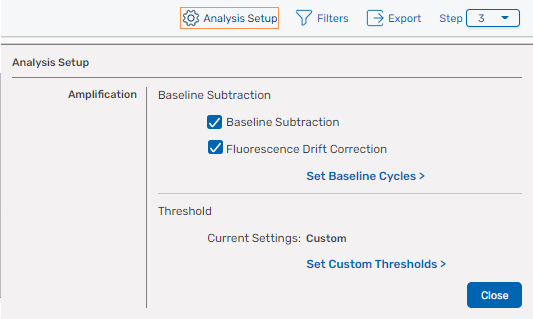
To apply drift correction
| ► | Select the Fluorescence Drift Correction checkbox. |
Setting Baseline Cycles
To adjust fluorescence baselines that were automatically set by BR.io for each well, you can adjust the number of cycles for fluorophores or targets in each well.
Note: Baseline cycles are applicable to amplification data only.
To enter a custom baseline cycle
| 1. | From the Analysis Setup screen, click Set Baseline Cycles. All wells appear in the screen. |
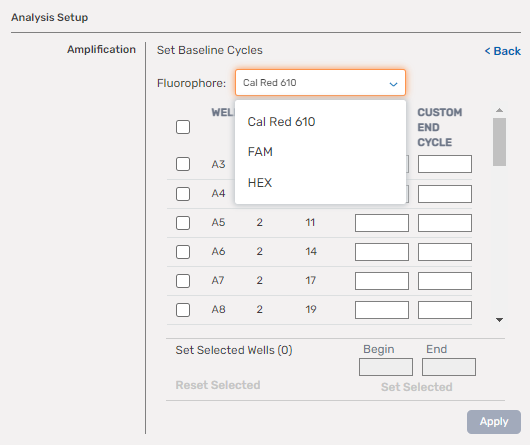
| 2. | Click the dropdown arrow and select a different fluorophore or target. |
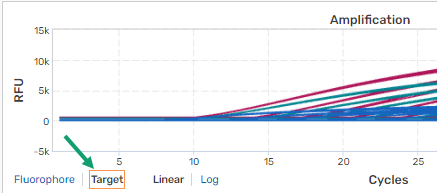
Important: By default, amplification data is set to analysis by fluorophore. If you want to reset baseline cycles by target you must select Target in the
Amplification chart, as shown in the following graphic.
| 3. | To change the cycle range, do one of the following: |
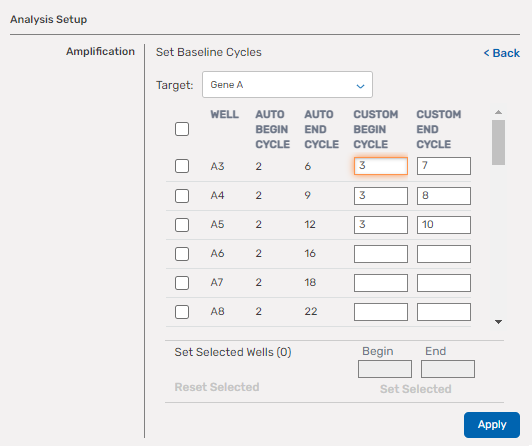
| ● | For a single well, enter a custom begin cycle and a custom end cycle in the corresponding fields and click Apply. |

| ● | For multiple wells |
| ○ | To enter different values, enter custom begin and custom end cycle values (as shown in the following graphic), and then click Apply. |
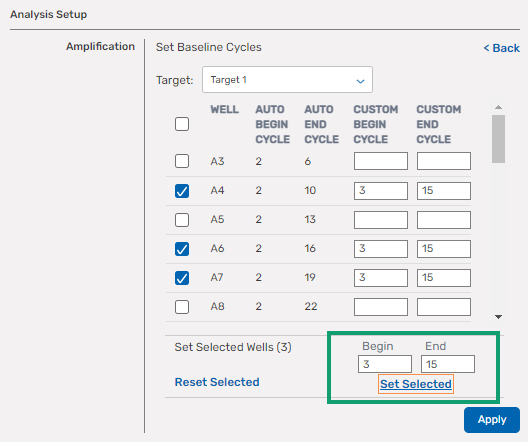
| ○ | To enter the same value, select each applicable well and then enter values in the Begin and End fields at the bottom of the screen (as shown in the following graphic), and then click Set Selected > Apply. |
| 4. | Repeat for all applicable fluorophores. |
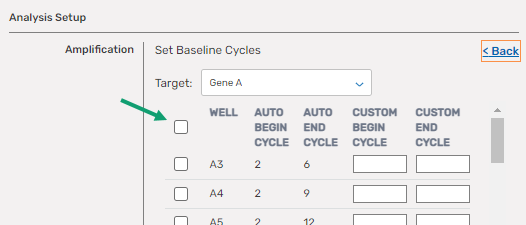
Tip: To select all wells, select the checkbox in the heading row.
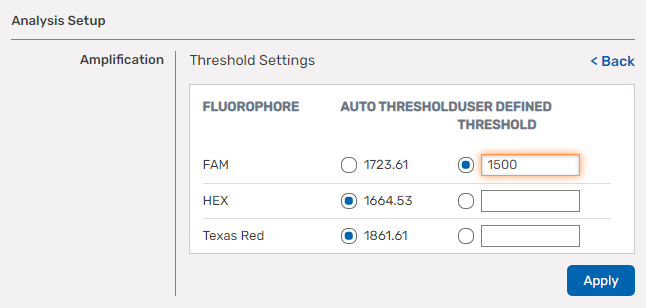
Setting Manual Thresholds
To set a manual threshold
| 1. | Click Set Custom Thresholds in the Threshold section. |
The Threshold Settings display appears.
By default, all Auto Threshold entries are enabled.
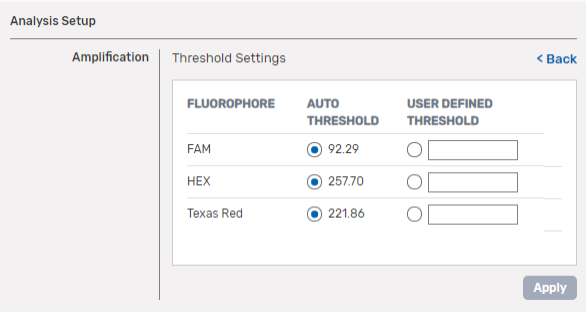
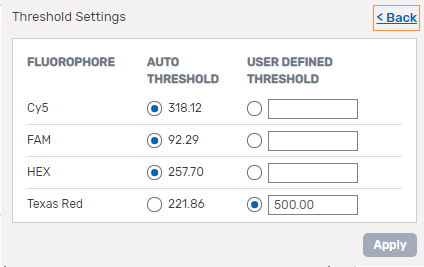
| 2. | To enable a User Defined Threshold field, select a radio button in the column. |
You can also create a user-defined melt peak threshold:
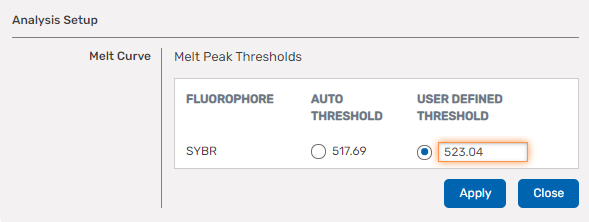
| 3. | Click in the field and enter the custom value. |
Note: To discard your entries and return to the Analysis Setup dialog box, click Back.
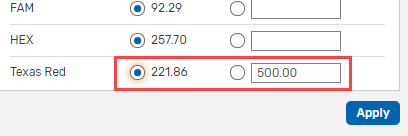
| 4. | When you are done, click Apply. |
Each corresponding Auto Threshold is disabled and the data is recalculated with the User Defined Threshold entries.
Note: When you click Apply, the dialog box remains open. To close it, click Back.
BR.io retains the automatic and manual thresholds, so you can switch between them without losing the last configured values.
Filtering Fluorophores or Targets from Analysis
All fluorophores are selected and displayed by default when you open the completed CFX run file. Using the Filters pop-up, you can show or hide fluorophores (or targets when the mode is set to Target) from the analysis while you are reviewing the data.
To use the filter
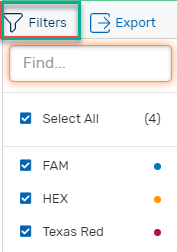
| 1. | Click Filters to display the pop-up menu. |
Note: Fluorophores are shown in the following graphic, but targets are displayed if you have selected Target.
| 2. | Clear checkboxes to remove fluorophores from the display. ' |
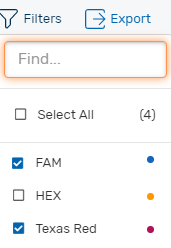
| 3. | Click Filters again to close the pop-up. |
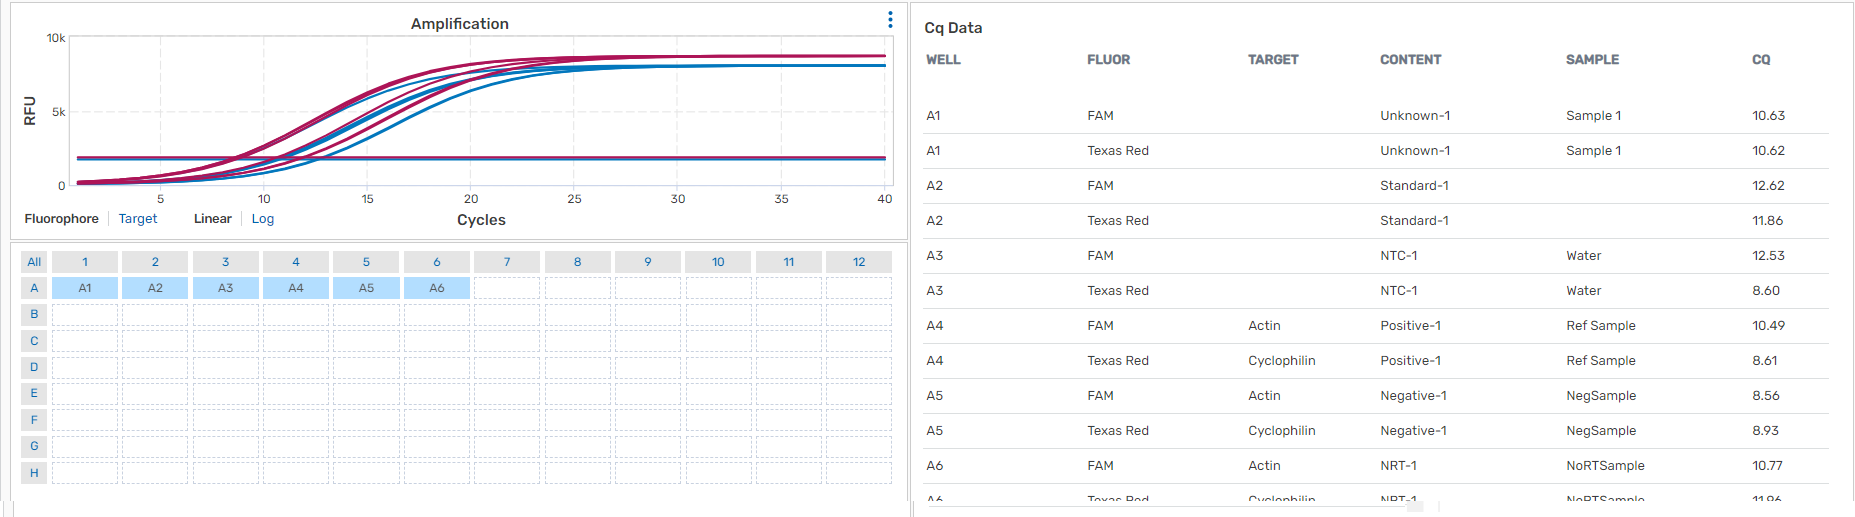
For the selected wells, with three of the fluorophores removed, the amplification chart and data table appears as shown in the following graphic.
Exporting Data to a CSV File
BR.io provides options to export the data corresponding to the amplification traces, and data from the Cq data, to CSV files.
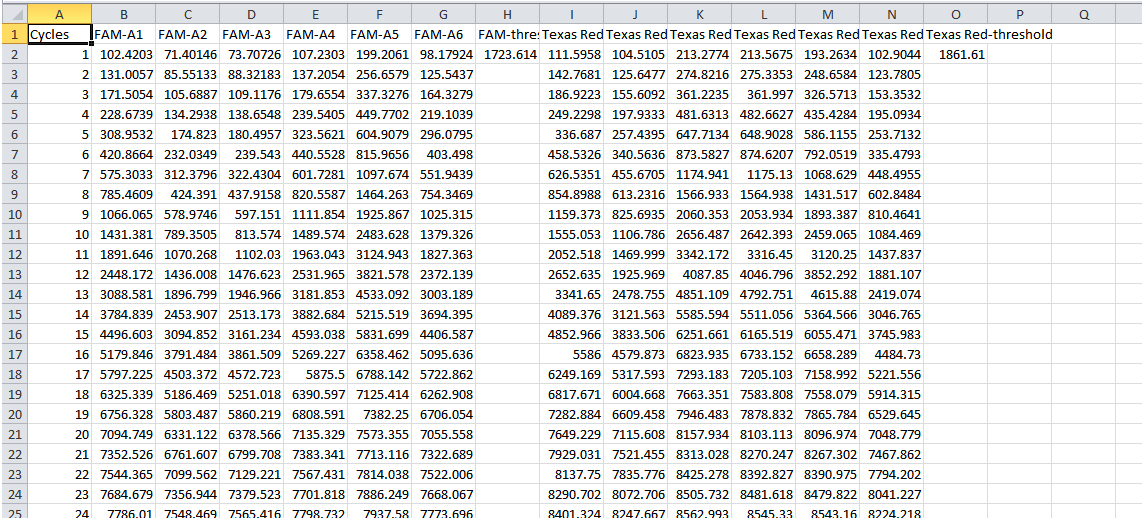
To export the chart data
| ► | Click the |
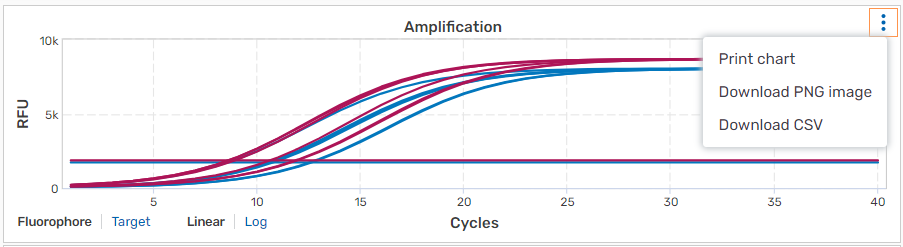
The trace data is immediately exported to a CSV file that you can open in Microsoft Excel. Following is a partial view of data from the above amplification chart.
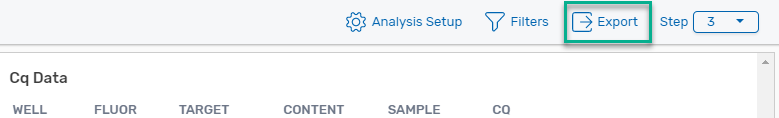
To export the Cq data table
| ► | In the toolbar on the right, click Export. |
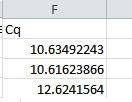
The data is immediately exported to a CSV file that you can open in Microsoft Excel. Following is a partial view of the table data:
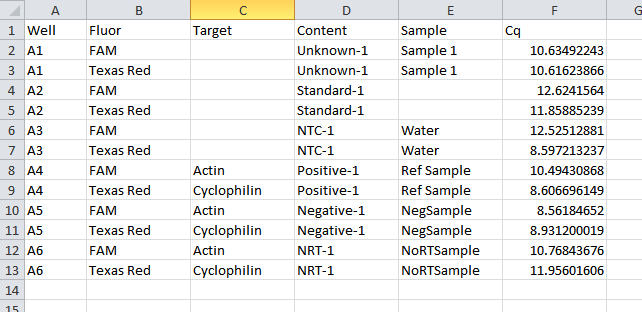
Tip: In the Excel file, click and drag the edge of a column to resize it and display full contents.
Selecting a Different Step
If your CFX run was performed using a protocol containing multiple steps with a plate read, use the Step selector to select the step to analyze. You can analyze data from one step a time only.
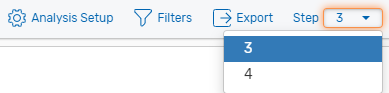
Fig. 1: Amplification Steps
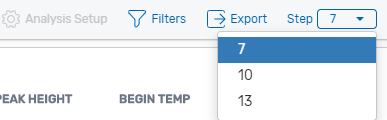
Fig. 2: Melt curve Steps
To analyze data from a different PCR step
| 1. | In the toolbar, click the Step dropdown arrow. |
| 2. | Select a different step from the list. |
The step in the field changes accordingly, and the associated data appears in the Analysis page.