Selecting the Wells to Display in the Chart and Table
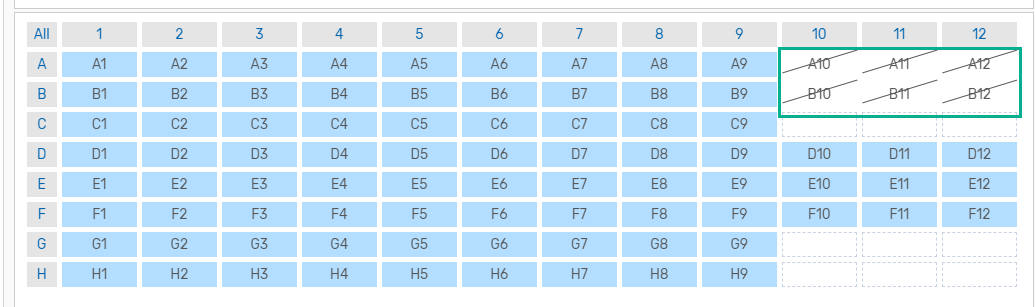
Wells in the well selector are in one of three states — empty, visible, and hidden. When you open a completed CFX run file for the first time, all non-empty wells are visible by default. You can toggle the visibility of wells to reduce the number of traces that appear simultaneously in the Amplification chart, as well as the number of rows in the data table, allowing you to review specific data points.
Important: If you export the data table, hidden wells are not included.
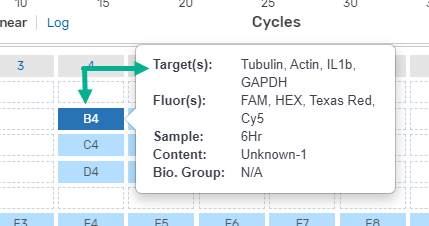
To see the well contents
| ► | Pause on a well to display its defined contents. |
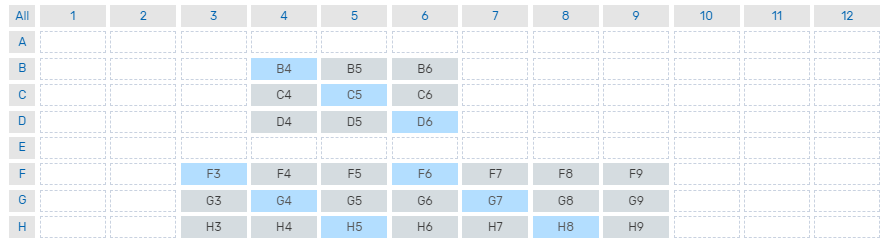
To toggle visibility of the wells represented in the chart and table
| ► | Do one of the following: |
| ● | For non-adjacent wells, click each applicable well to toggle its visibility. |
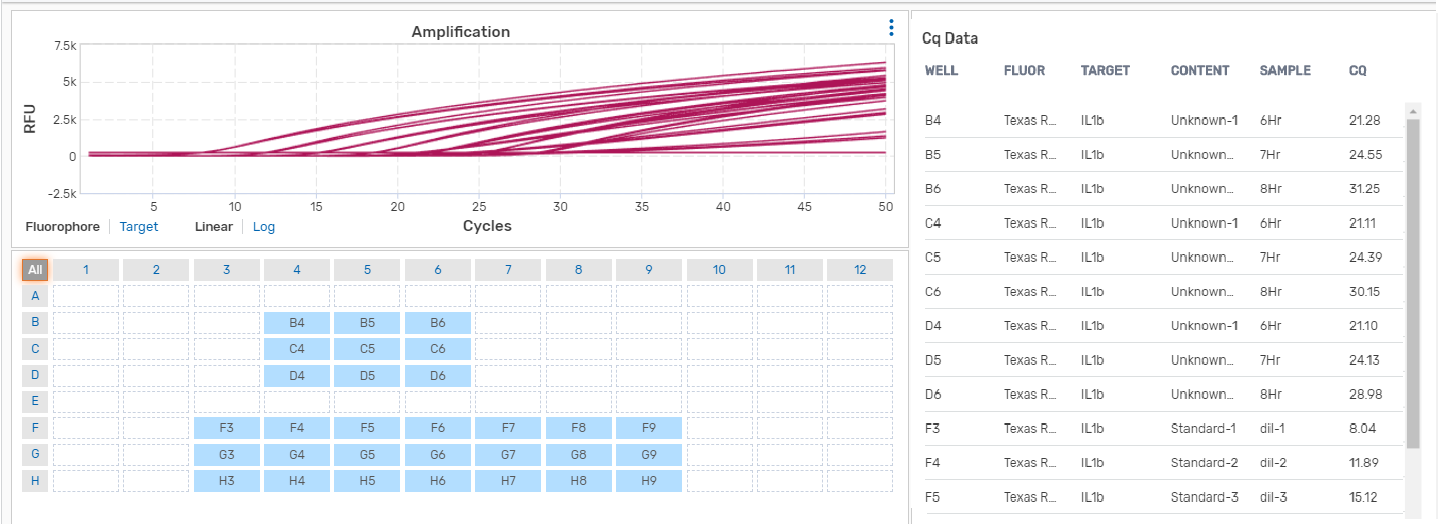
| ● | For adjacent wells, press the left mouse button on the initial well (F3 in the following example) and drag the cursor over wells, and then release the mouse button. |
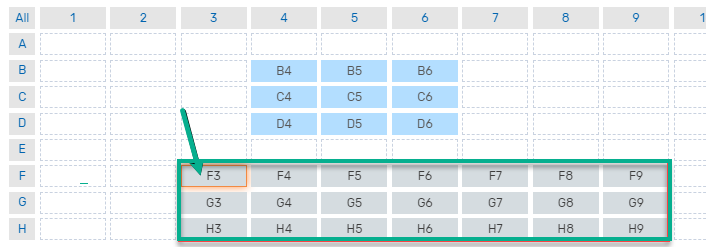
For the wells selected, the amplification chart and data table appears as shown in the following graphic.
Note: Wells that were excluded before the run are displayed with a diagonal line.