
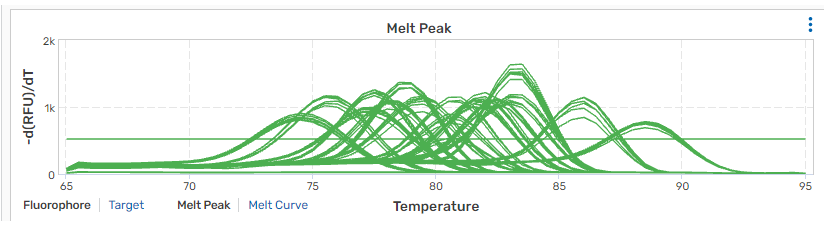
Viewing the Melt Peak Chart
By default, melt peak data appears by fluorophore for all wells.
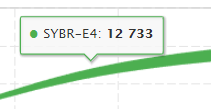
To show a tooltip with information for the specified trace
| ► | Roll the cursor over each trace to view information for a data point in a tooltip. |
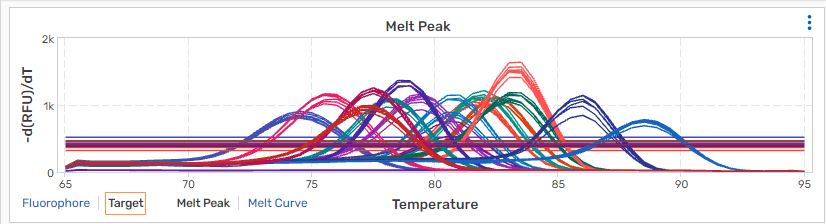
To show traces by target
| ► | Click Target. |
Note: To export the chart, see Printing or Downloading Chart Images.