
Viewing the Amplification Data Table
The table on the right contains calculated data for the selected wells. When you open the file, all wells are selected by default.
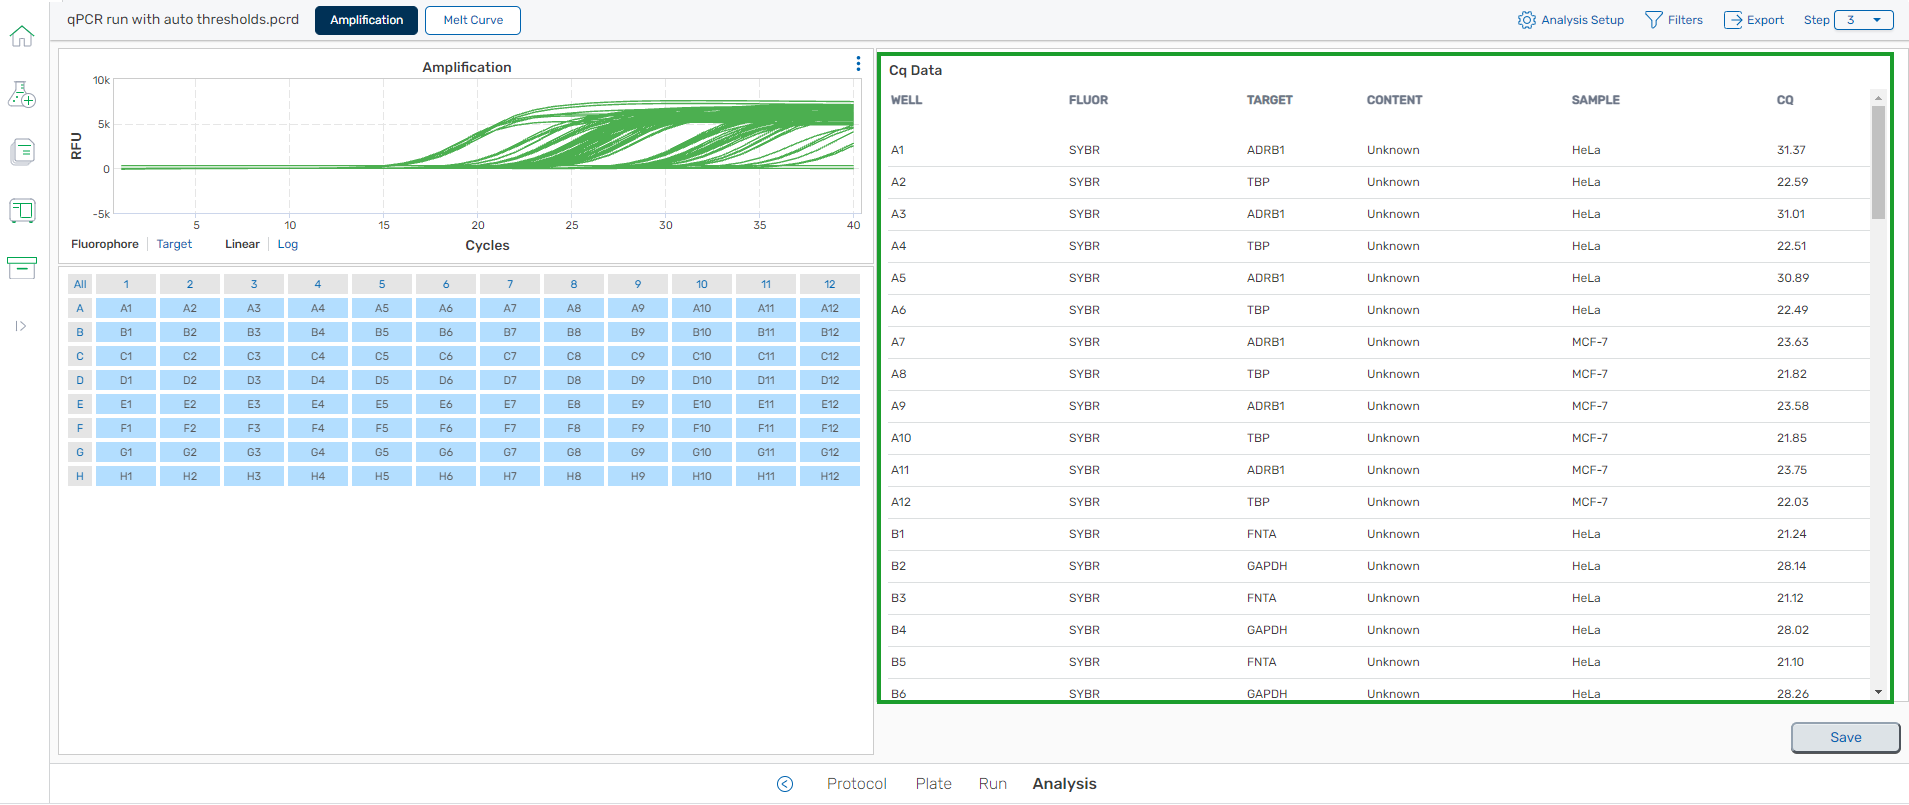
The table below describes the contents of each column.
|
Column heading |
Content description (for each selected well) |
|---|---|
|
Well |
Well identifier |
|
Fluor |
Fluorophore name |
|
Target |
Target name |
|
Content |
Sample type and replicate ID |
|
Sample |
Sample identifier |
|
Cq |
Quantification cycle for each trace (cycle number where the amplification curve crossed the threshold) |
Note: To export the data table to a CSV file, see Exporting Data to a CSV File.