Collecting Information about Google Chrome
To assist with resolving the error, Bio-Rad recommends collecting information regarding your Chrome browser to help with troubleshooting. Complete the procedures described in the following subsections:
To record the information, do one of the following:
Note: Screen shots that you capture should be stored in the BR.io_Errors folder you created in Taking Screen Shots, in the Mac Computer section.
Capturing Browser and JavaScript Versions
To identify the browser and JavaScript versions
|
1.
|
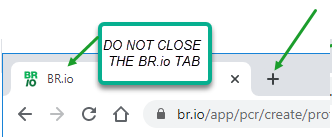
Keeping the BR.io tab (page) with the error open, click + to open a new tab. |
|
2.
|
Select the new tab and in the URL address field, enter chrome://version. |
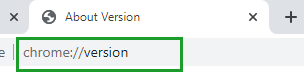
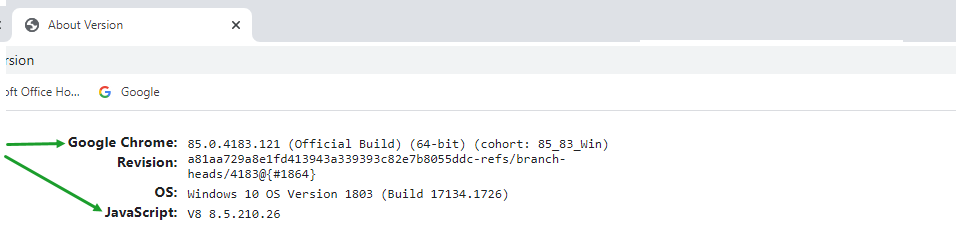
Chrome displays the information shown below.
|
3.
|
Enter the Google Chrome version and JavaScript version into the error form or email body: |
Capturing BR.io Memory Usage
To capture the BR.io memory usage in a screen shot
|
1.
|
Keeping the BR.io tab (page) with the error open, click + to open a new tab. |
|
2.
|
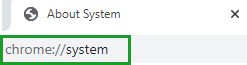
Select the new tab and In the URL address field, enter chrome://system. |
|
3.
|
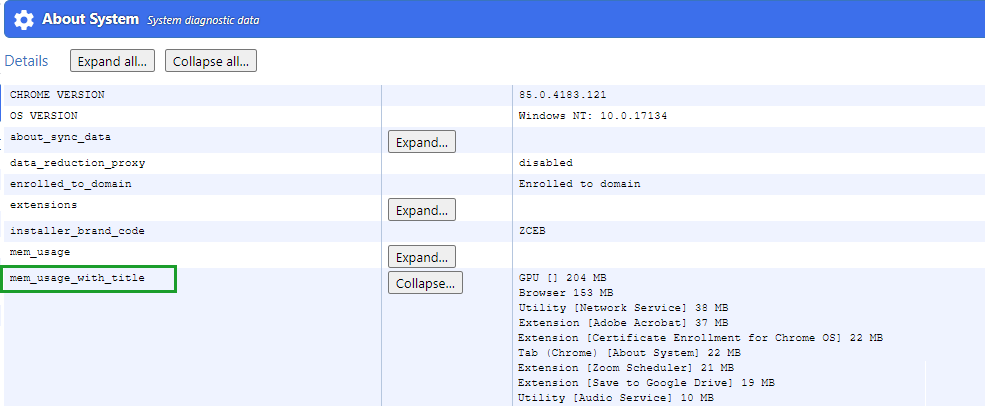
Next to mem_usage_with_title, click Expand. The button label changes to Collapse, as shown below. |
|
4.
|
Take a screen shot of the entire area. |
Capturing the Network History
To capture the network history
|
1.
|
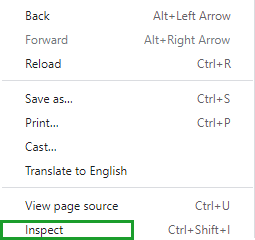
Right-click in the BR.io page where the error occurred to display the following pop-up. |
|
2.
|
Click Inspect to display the Chrome development tools pane. |
|
3.
|
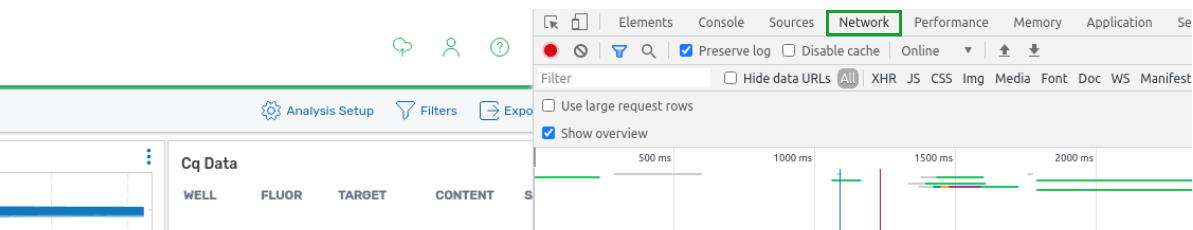
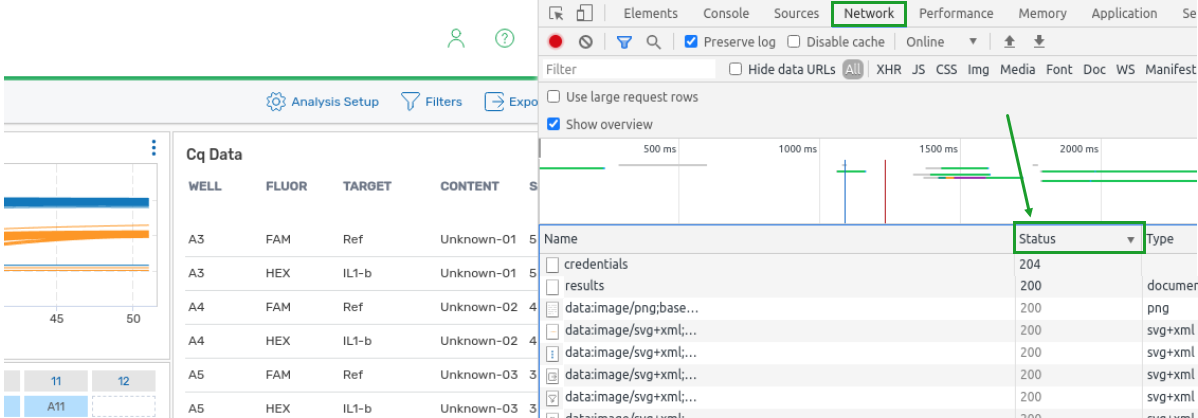
In the menu bar, click Network. |
|
4.
|
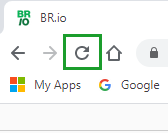
Click the Refresh icon on the left to refresh the page. |
|
5.
|
Select the Status column heading and click it twice to resort the column. |
|
6.
|
Take a screen shot of the entire area and continue to the next section. |
Capturing the JavaScript Console
To capture the JavaScript Console
Note: The steps below assume the Chrome development tools pane is open. If not, complete steps 1 and 2 in Capturing the Network History.
|
1.
|
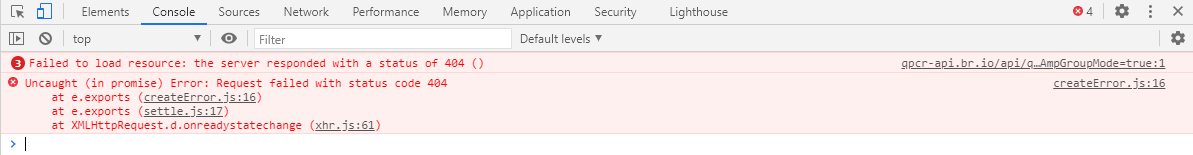
In the menu bar, click Console. |

|
2.
|
Click the Refresh icon to refresh the page |
The page displays text regarding the error.
|
3.
|
Take a screen shot of the entire area and continue to the next section. |
Capturing the Browser Local Storage
To capture the browser local storage
Note: The steps below assume the Chrome development tools pane is open. If not, complete steps 1 and 2 in Capturing the Network History.
|
1.
|
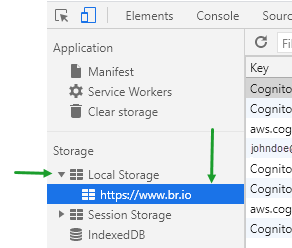
In the menu bar, click Application. |

|
2.
|
On the left, click the arrow next to Local Storage. |
|
3.
|
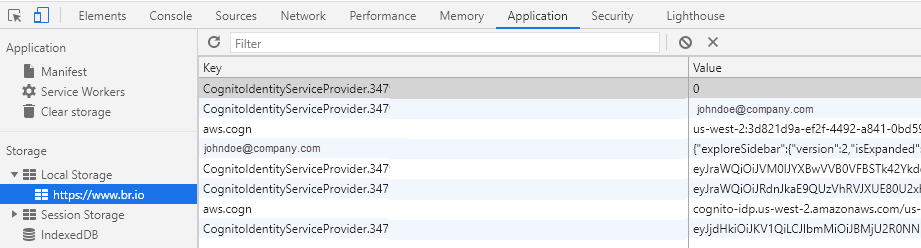
Click the entry for https://br.io.com. |
The keys and values appear on the right.
|
4.
|
Take a screen shot of the entire area. |
|
5.
|
To close the Chrome development tools, click the X in the upper-right corner. |