
Analyzing the Melt Data
Along with amplification data in the BR.io analysis module, you can view and analyze melt curve data to assess certain characteristics of double-stranded DNA.
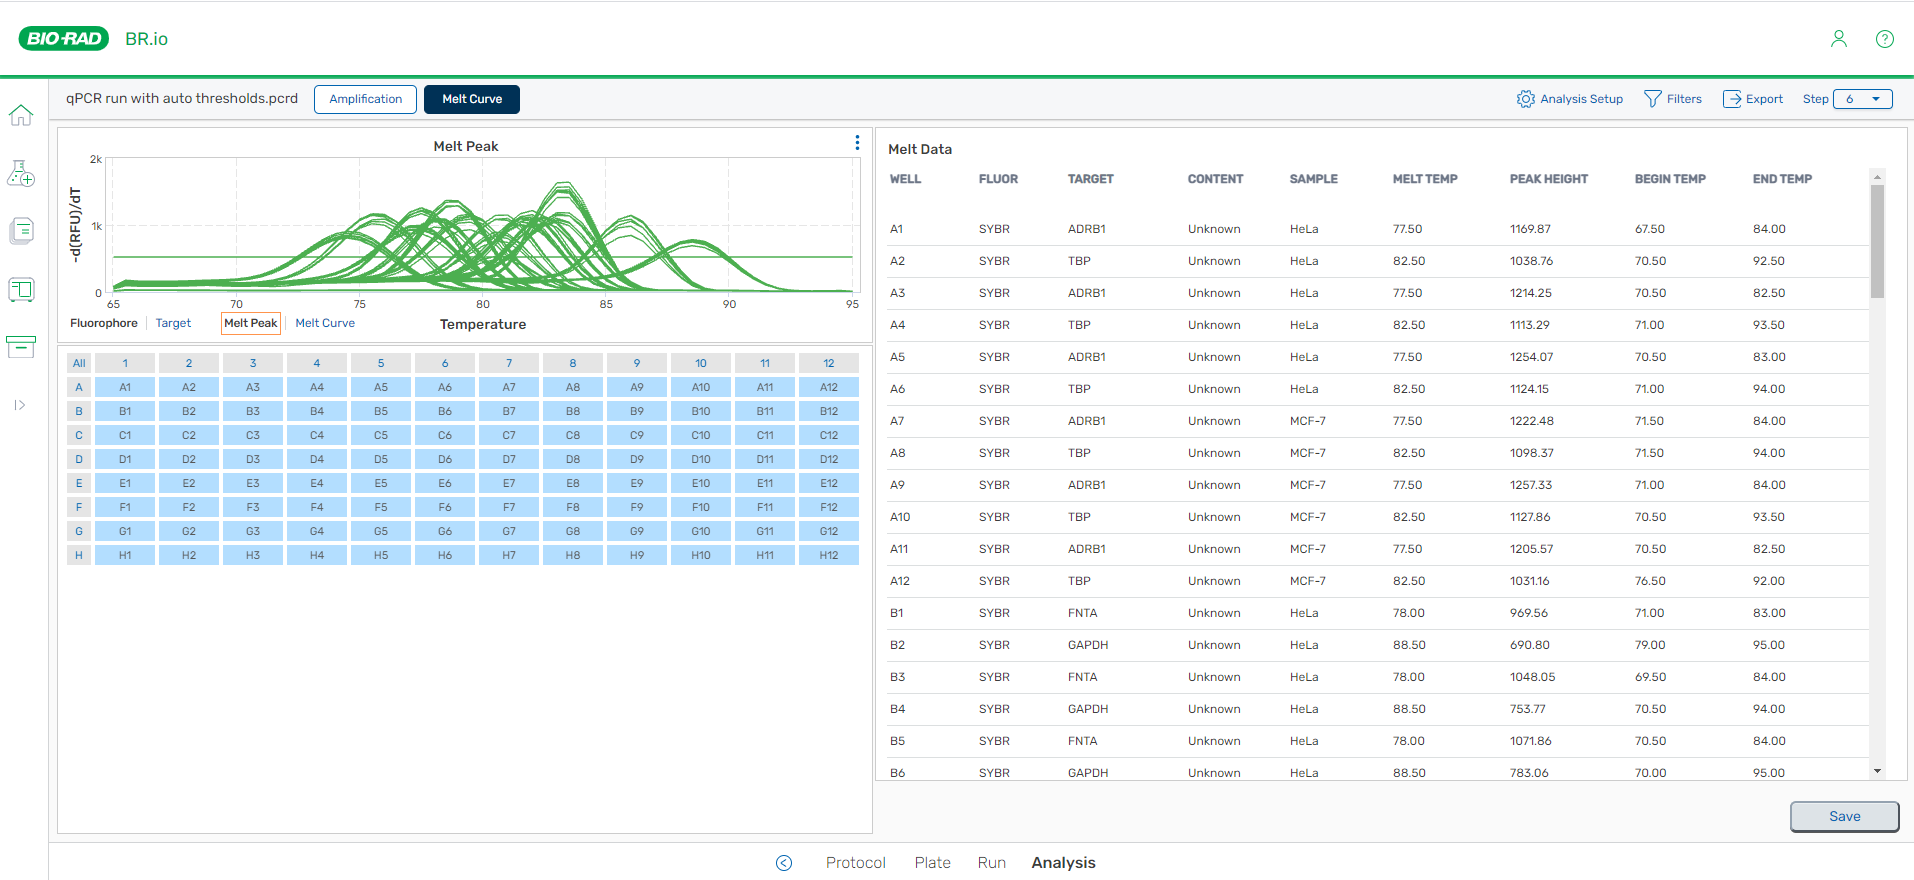
When melt curve data is available, a Melt Curve button is visible next to the Amplification button. When selected, the page displays the melt peak chart by fluorophore by default, and all melt data in the data table.
When the display appears, all wells are selected by default. To change the number of selected wells, see Selecting the Wells to Appear in the Chart and Table.
From the Melt Curve page, you can
| ● | Choose to analyze and display data by |
| ○ | Target or fluorophore |
| ○ | Melt peak or melt curve |
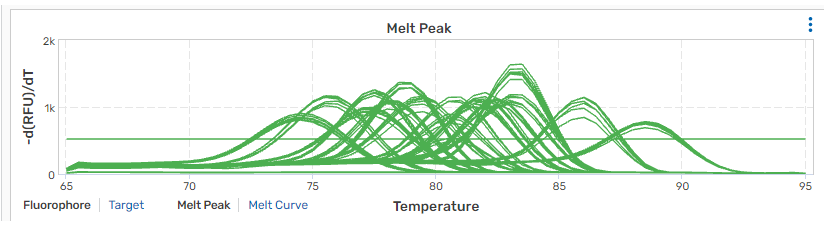
| ● | View the negative first derivative of the RFU data per temperature for each well (melt peak) |
| ● | View the real-time data for each fluorophore as RFUs per temperature for each well (melt curve) |
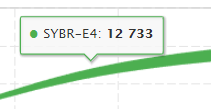
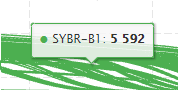
| ● | Pause on a trace on the chart to view the fluorophore or target name, well location, and negative regression RFUs (melt peak) or real-time RFUs (melt curve) |
See also
Printing or downloading chart images
Saving changes to the analyzed CFX run
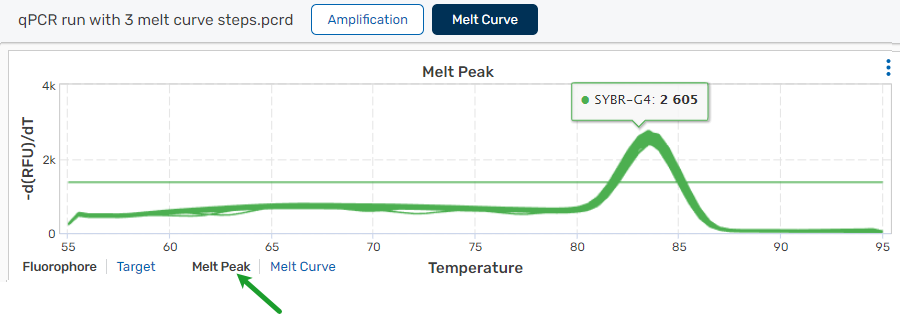
Viewing the Melt Peak Chart
By default, melt peak data appears by fluorophore for all wells.
To show a tooltip with information for the specified trace
| ► | Roll the cursor over each trace to view information for a data point in a tooltip. |
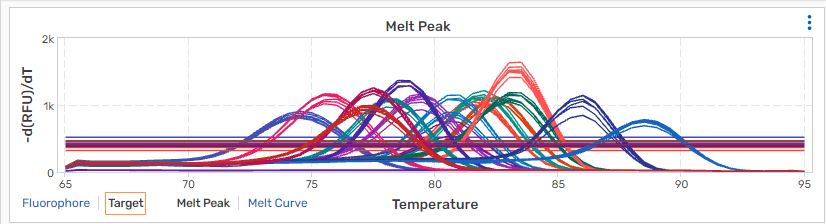
To show traces by target
| ► | Click Target. |
Note: To export the chart, see Printing or Downloading Chart Images.
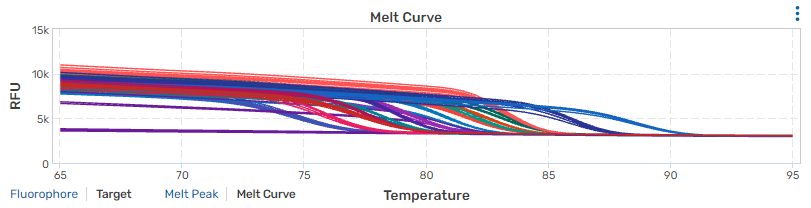
Viewing the Melt Curve Chart
To view the melt curve chart
| ► | Click the Melt Curve link to change to the melt curve view. |
To show a tooltip with information for the specified trace
| ► | Roll the cursor over each trace to view information for a data point in a tooltip. |
To show traces by target
| ► | Click Target. |
Note: To export the chart, see Printing or Downloading Chart Images.
Viewing the Melt Data Table
The table on the right contains calculated melt data.
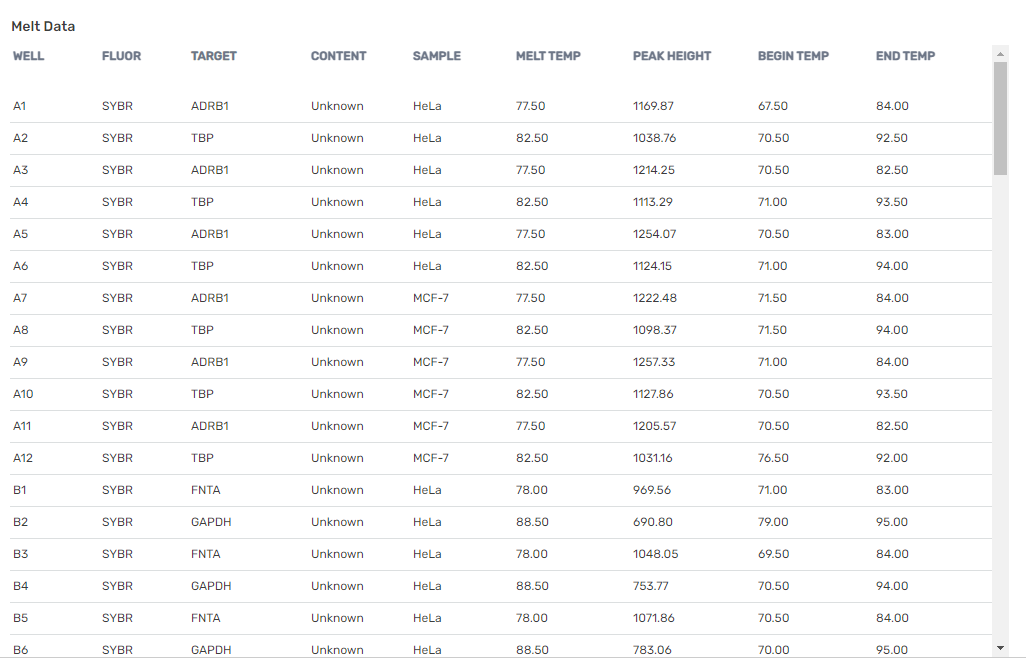
The table below describes the contents of each column.
|
Column heading |
Content description (for each selected well) |
|---|---|
|
Well |
Well identifier |
|
Fluor |
Fluorophore name |
|
Target |
Target name |
|
Content |
Sample type and replicate ID |
|
Sample |
Sample identifier |
|
Melt Temp |
The melting temperature of each product, listed as the highest peak |
|
Peak Height |
Height of the peak |
|
Begin Temp |
Temperature at the start of the melt step |
|
End Temp |
Temperature at the end of the melt step |
Note: To export the data table to a CSV file, see Exporting Data to a CSV File.